本笔记本演示了如何使用新的 Assistants API (GPT-4) 和 DALL·E-3 来制作信息丰富且视觉上吸引人的幻灯片。
创建幻灯片是许多工作中至关重要的一环,但可能既费力又耗时。此外,从数据中提取见解并在幻灯片上有效地表达出来也可能具有挑战性。
本食谱将演示如何利用新的 Assistants API 来帮助您完成端到端的幻灯片创建过程,而无需您接触 Microsoft PowerPoint 或 Google 幻灯片,从而为您节省宝贵的时间和精力!
0. 设置
from IPython.display import display, Image
from openai import OpenAI
import os
import pandas as pd
import json
import io
from PIL import Image
import requests

client = OpenAI(api_key=os.environ.get("OPENAI_API_KEY", "<your OpenAI API key if not set as env var>"))

#Lets import some helper functions for assistants from https://openaicookbook.cn/examples/assistants_api_overview_python
def show_json(obj):
    display(json.loads(obj.model_dump_json()))

def submit_message(assistant_id, thread, user_message,file_ids=None):
    params = {
        'thread_id': thread.id,
        'role': 'user',
        'content': user_message,
    }
    if file_ids:
        params['file_ids']=file_ids

    client.beta.threads.messages.create(
        **params
)
    return client.beta.threads.runs.create(
    thread_id=thread.id,
    assistant_id=assistant_id,
)

def get_response(thread):
    return client.beta.threads.messages.list(thread_id=thread.id)
1. 创建内容
在本食谱中,我们将为我们公司 NotReal Corporation 的季度财务审查创建一个简短的虚构演示文稿。我们希望强调我们看到的一些正在影响公司盈利能力的关键趋势。
假设我们有一些财务数据可供使用。让我们加载数据,并查看一下...
financial_data_path = 'data/NotRealCorp_financial_data.json'
financial_data = pd.read_json(financial_data_path)
financial_data.head(5)
| 年份 | 季度 | 分销渠道 | 收入(百万美元) | 成本(百万美元) | 客户数量 | 时间 | |
|---|---|---|---|---|---|---|---|
| 0 | 2021 | 第一季度 | 在线销售 | 1.50 | 1.301953 | 150 | 2021年 第一季度 |
| 1 | 2021 | 第一季度 | 直销 | 1.50 | 1.380809 | 151 | 2021年 第一季度 |
| 2 | 2021 | 第一季度 | 零售合作伙伴 | 1.50 | 1.348246 | 152 | 2021年 第一季度 |
| 3 | 2021 | 第二季度 | 在线销售 | 1.52 | 1.308608 | 152 | 2021年 第二季度 |
| 4 | 2021 | 第二季度 | 直销 | 1.52 | 1.413305 | 153 | 2021年 第二季度 |
如您所见,此数据包含不同分销渠道的季度收入、成本和客户数据。让我们创建一个 Assistant,它可以充当私人分析师,并为我们的 PowerPoint 制作一个漂亮的图表!
首先,我们需要上传我们的文件,以便我们的 Assistant 可以访问它。
file = client.files.create(
  file=open('data/NotRealCorp_financial_data.json',"rb"),
  purpose='assistants',
)
现在,我们准备创建我们的 Assistant。我们可以指示我们的 assistant 充当数据科学家,并接受我们给它的任何查询,并运行必要的代码来输出适当的数据可视化。这里的 instructions 参数类似于 ChatCompletions 端点中的系统指令,可以帮助指导 assistant。我们还可以启用代码解释器工具,以便我们的 Assistant 能够编写代码。最后,我们可以指定任何我们想要使用的文件,在本例中,这只是我们上面创建的 `financial_data` 文件。
assistant = client.beta.assistants.create(
  instructions="You are a data scientist assistant. When given data and a query, write the proper code and create the proper visualization",
  model="gpt-4-1106-preview",
  tools=[{"type": "code_interpreter"}],
  file_ids=[file.id]
)
现在让我们创建一个线程,并将我们的第一个请求设置为让 Assistant 计算季度利润,然后绘制按分销渠道随时间变化的利润。assistant 将自动计算每个季度的利润,并创建一个新列,将季度和年份组合在一起,而无需我们直接要求这样做。我们还可以指定每条线的颜色。
thread = client.beta.threads.create(
  messages=[
    {
      "role": "user",
      "content": "Calculate profit (revenue minus cost) by quarter and year, and visualize as a line plot across the distribution channels, where the colors of the lines are green, light red, and light blue",
      "file_ids": [file.id]
    }
  ]
)
现在我们可以执行我们线程的运行
run = client.beta.threads.runs.create(
    thread_id=thread.id,
    assistant_id=assistant.id,
)
我们现在可以启动一个循环来检查图像是否已创建。注意:这可能需要几分钟
messages = client.beta.threads.messages.list(thread_id=thread.id)
import time

while True:
    messages = client.beta.threads.messages.list(thread_id=thread.id)
    try:
        #See if image has been created
        messages.data[0].content[0].image_file
        #Sleep to make sure run has completed
        time.sleep(5)
        print('Plot created!')
        break
    except:
        time.sleep(10)
        print('Assistant still working...')
Assistant still working...
Assistant still working...
Assistant still working...
Assistant still working...
Assistant still working...
Assistant still working...
Assistant still working...
Assistant still working...
Assistant still working...
Assistant still working...
Assistant still working...
Assistant still working...
Assistant still working...
Assistant still working...
Assistant still working...
Assistant still working...
Assistant still working...
Plot created!
让我们看看 Assistant 添加的消息。
messages = client.beta.threads.messages.list(thread_id=thread.id)
[message.content[0] for message in messages.data]
[MessageContentImageFile(image_file=ImageFile(file_id='file-0rKABLygI02MgwwhpgWdRFY1'), type='image_file'),
 MessageContentText(text=Text(annotations=[], value="The profit has been calculated for each distribution channel by quarter and year. Next, I'll create a line plot to visualize these profits. As specified, I will use green for the 'Online Sales', light red for 'Direct Sales', and light blue for 'Retail Partners' channels. Let's create the plot."), type='text'),
 MessageContentText(text=Text(annotations=[], value="The JSON data has been successfully restructured into a tabular dataframe format. It includes the year, quarter, distribution channel, revenue, costs, customer count, and a combined 'Time' representation of 'Year Quarter'. Now, we have the necessary information to calculate the profit (revenue minus cost) by quarter and year.\n\nTo visualize the profit across the different distribution channels with a line plot, we will proceed with the following steps:\n\n1. Calculate the profit for each row in the dataframe.\n2. Group the data by 'Time' (which is a combination of Year and Quarter) and 'Distribution channel'.\n3. Aggregate the profit for each group.\n4. Plot the aggregated profits as a line plot with the distribution channels represented in different colors as requested.\n\nLet's calculate the profit for each row and then continue with the visualization."), type='text'),
 MessageContentText(text=Text(annotations=[], value='The structure of the JSON data shows that it is a dictionary with "Year", "Quarter", "Distribution channel", and potentially other keys that map to dictionaries containing the data. The keys of the inner dictionaries are indices, indicating that the data is tabular but has been converted into a JSON object.\n\nTo properly convert this data into a DataFrame, I will restructure the JSON data into a more typical list of dictionaries, where each dictionary represents a row in our target DataFrame. Subsequent to this restructuring, I can then load the data into a Pandas DataFrame. Let\'s restructure and load the data.'), type='text'),
 MessageContentText(text=Text(annotations=[], value="The JSON data has been incorrectly loaded into a single-row DataFrame with numerous columns representing each data point. This implies the JSON structure is not as straightforward as expected, and a direct conversion to a flat table is not possible without further processing.\n\nTo better understand the JSON structure and figure out how to properly normalize it into a table format, I will print out the raw JSON data structure. We will analyze its format and then determine the correct approach to extract the profit by quarter and year, as well as the distribution channel information. Let's take a look at the JSON structure."), type='text'),
 MessageContentText(text=Text(annotations=[], value="It seems that the file content was successfully parsed as JSON, and thus, there was no exception raised. The variable `error_message` is not defined because the `except` block was not executed.\n\nI'll proceed with displaying the data that was parsed from JSON."), type='text'),
 MessageContentText(text=Text(annotations=[], value="It appears that the content of the dataframe has been incorrectly parsed, resulting in an empty dataframe with a very long column name that seems to contain JSON data rather than typical CSV columns and rows.\n\nTo address this issue, I will take a different approach to reading the file. I will attempt to parse the content as JSON. If this is not successful, I'll adjust the loading strategy accordingly. Let's try to read the contents as JSON data first."), type='text'),
 MessageContentText(text=Text(annotations=[], value="Before we can calculate profits and visualize the data as requested, I need to first examine the contents of the file that you have uploaded. Let's go ahead and read the file to understand its structure and the kind of data it contains. Once I have a clearer picture of the dataset, we can proceed with the profit calculations. I'll begin by loading the file into a dataframe and displaying the first few entries to see the data schema."), type='text'),
 MessageContentText(text=Text(annotations=[], value='Calculate profit (revenue minus cost) by quarter and year, and visualize as a line plot across the distribution channels, where the colors of the lines are green, light red, and light blue'), type='text')]
我们可以看到,来自 assistant 的最后一条消息(最新消息首先显示)包含我们正在寻找的图像文件。这里一个有趣的注意点是,Assistant 能够多次尝试解析 JSON 数据,因为第一次解析不成功,这展示了 assistant 的适应性。
# Quick helper function to convert our output file to a png
def convert_file_to_png(file_id, write_path):
    data = client.files.content(file_id)
    data_bytes = data.read()
    with open(write_path, "wb") as file:
        file.write(data_bytes)
plot_file_id = messages.data[0].content[0].image_file.file_id
image_path = "../images/NotRealCorp_chart.png"
convert_file_to_png(plot_file_id,image_path)

#Upload
plot_file = client.files.create(
  file=open(image_path, "rb"),
  purpose='assistants'
)
让我们加载图表!
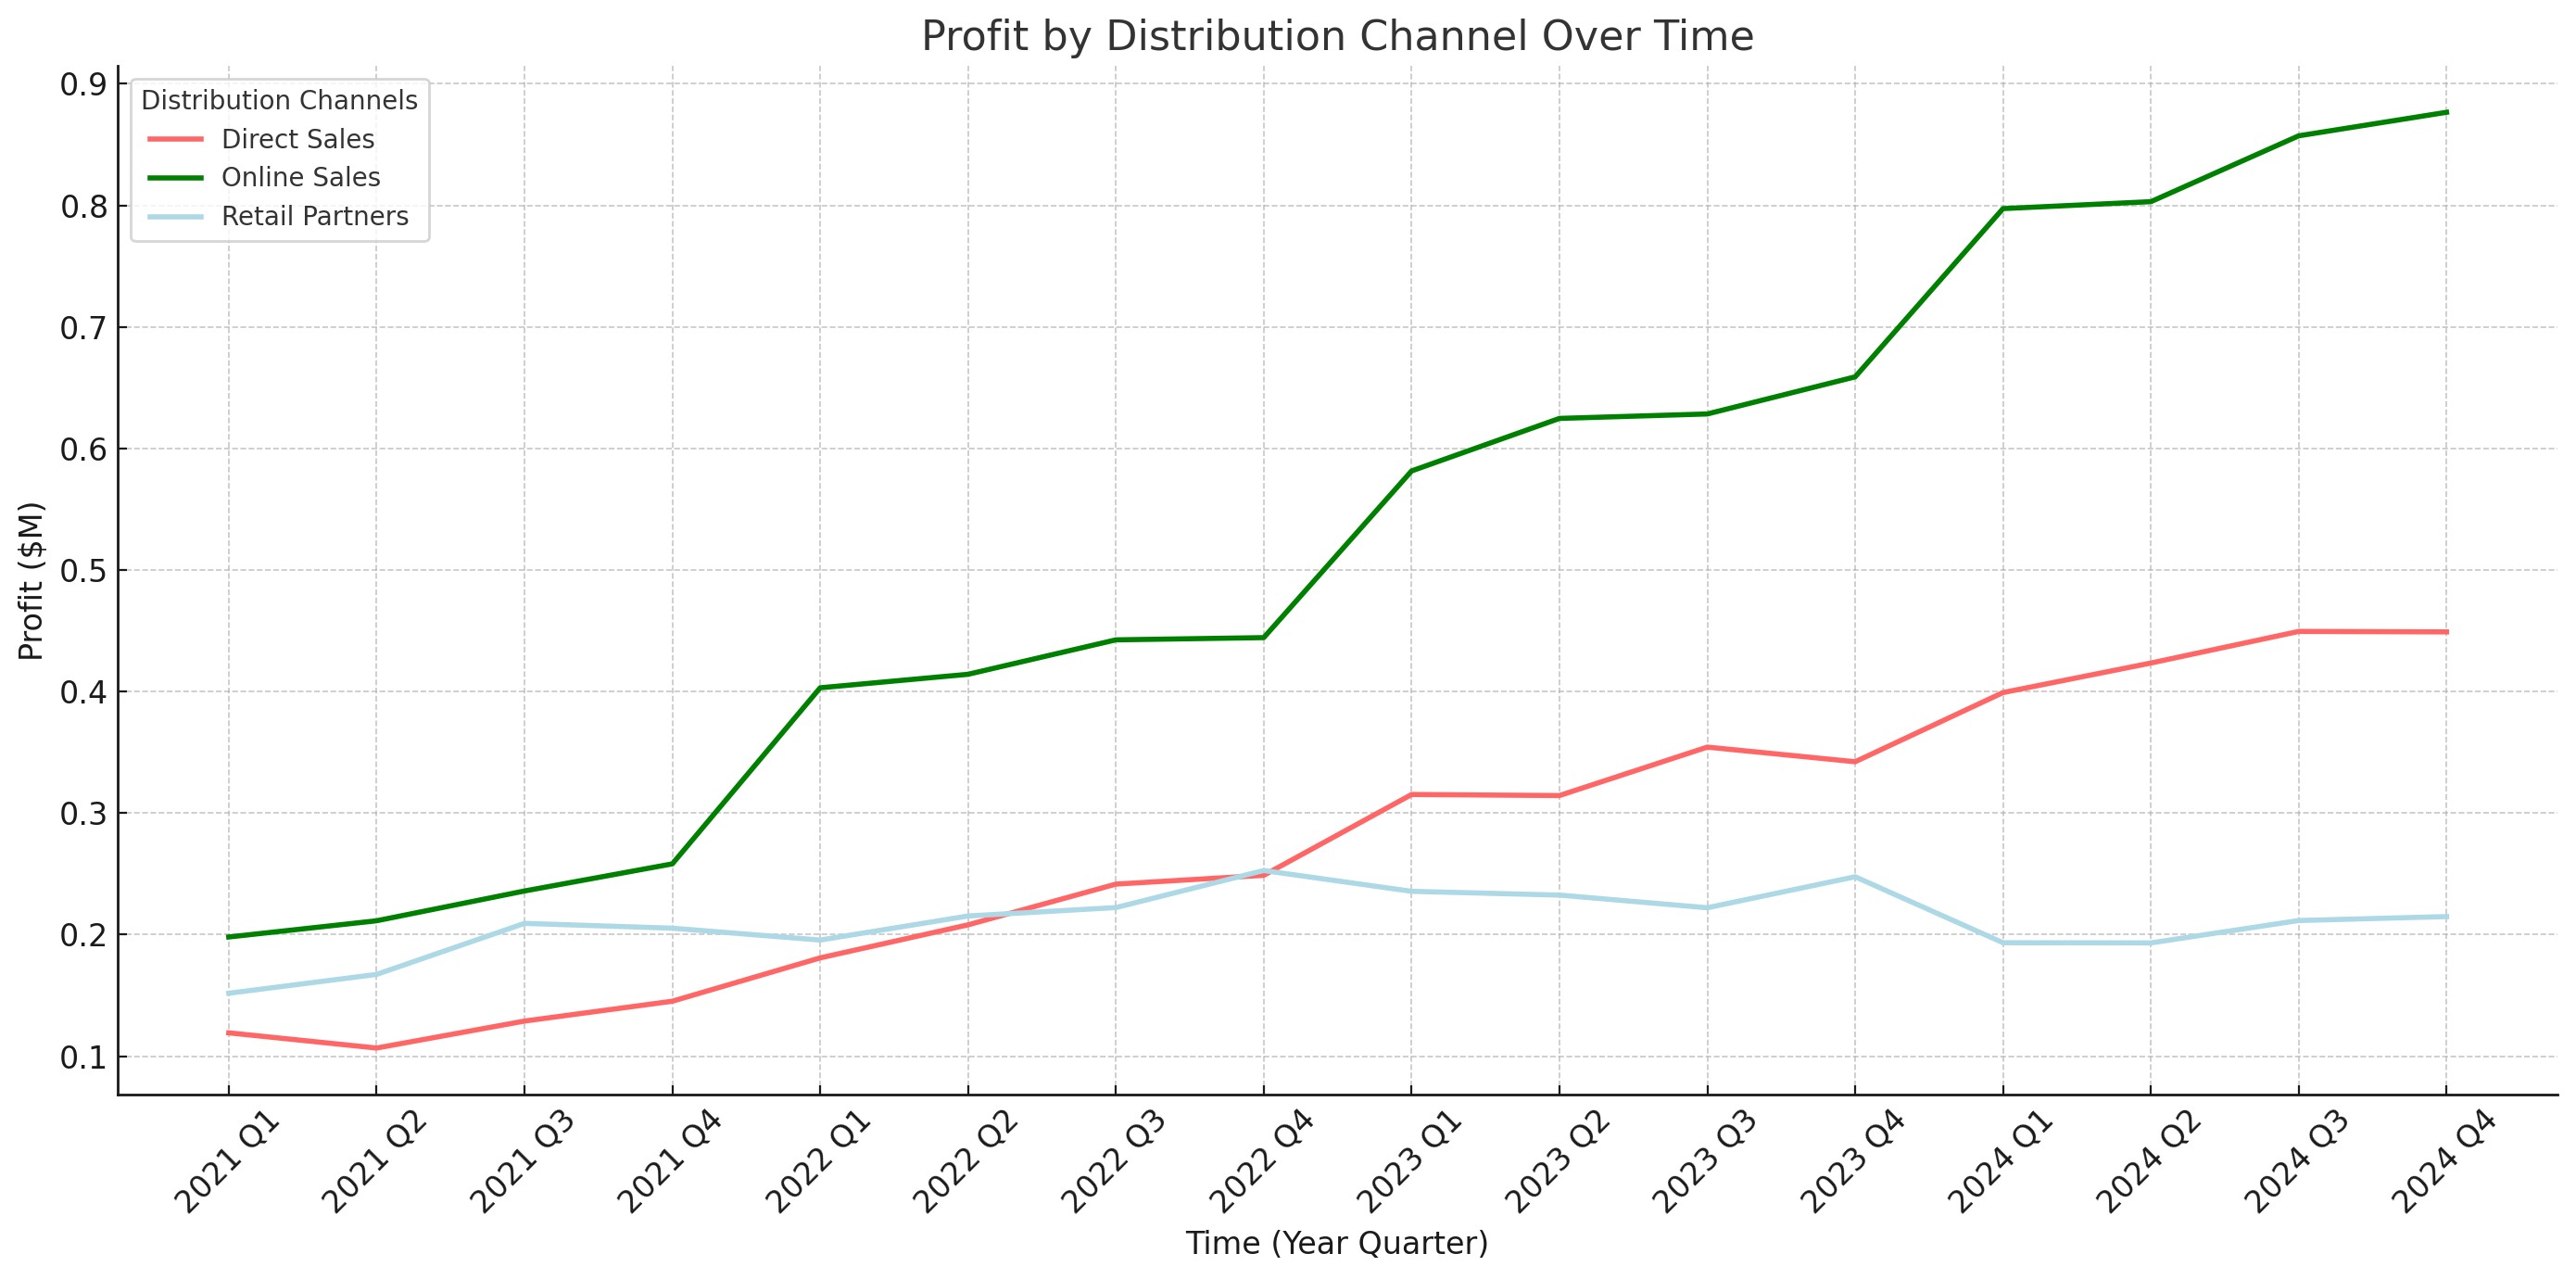
太棒了!因此,仅用一句话,我们就能够让我们的 assistant 使用代码解释器来计算盈利能力,并绘制各个分销渠道的三条折线图。
现在我们为幻灯片准备了一张漂亮的图表,但我们想要一些与之相关的见解。
2. 生成见解
要从我们的图像中获得见解,我们只需向我们的线程添加一条新消息。我们的 Assistant 将知道使用消息历史记录,从提供的视觉效果中为我们提供一些简洁的要点。
submit_message(assistant.id,thread,"Give me two medium length sentences (~20-30 words per sentence) of the \
      most important insights from the plot you just created.\
             These will be used for a slide deck, and they should be about the\
                     'so what' behind the data."
)
Run(id='run_NWoygMcBfHUr58fCE4Cn6rxN', assistant_id='asst_3T362kLlTyAq0FUnkvjjQczO', cancelled_at=None, completed_at=None, created_at=1701827074, expires_at=1701827674, failed_at=None, file_ids=['file-piTokyHGllwGITzIpoG8dok3'], instructions='You are a data scientist assistant. When given data and a query, write the proper code and create the proper visualization', last_error=None, metadata={}, model='gpt-4-1106-preview', object='thread.run', required_action=None, started_at=None, status='queued', thread_id='thread_73TgtFoJMlEJvb13ngjTnAo3', tools=[ToolAssistantToolsCode(type='code_interpreter')])现在,一旦运行完成,我们可以看到最新的消息
# Hard coded wait for a response, as the assistant may iterate on the bullets.
time.sleep(10)
response = get_response(thread)
bullet_points = response.data[0].content[0].text.value
print(bullet_points)
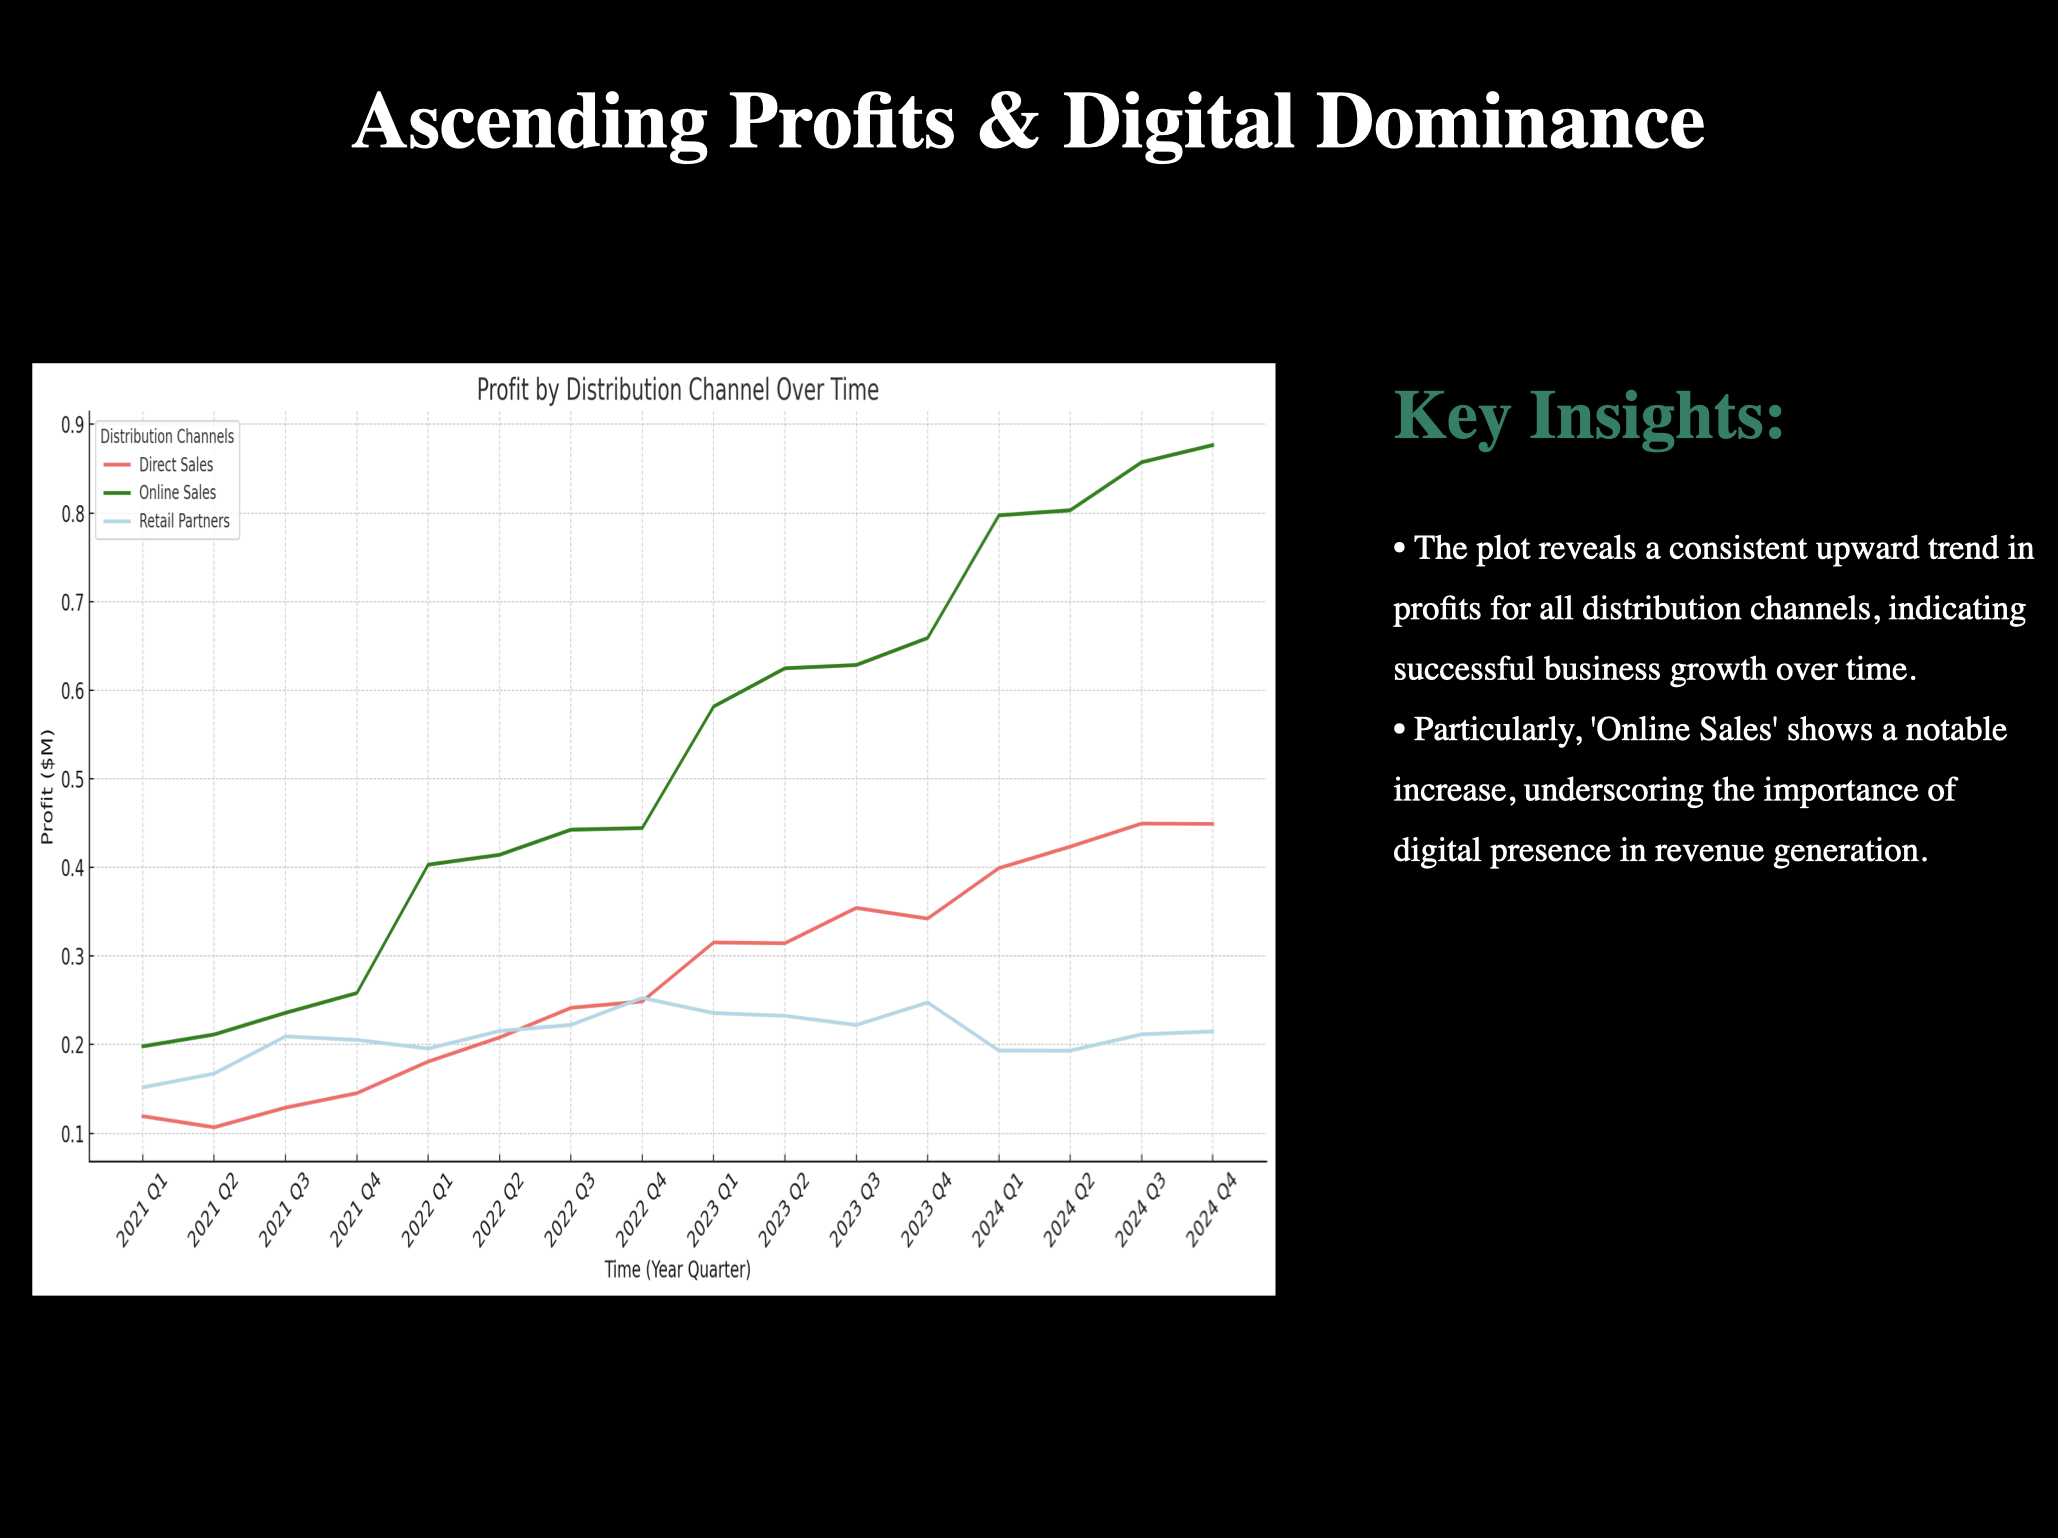
The plot reveals a consistent upward trend in profits for all distribution channels, indicating successful business growth over time. Particularly, 'Online Sales' shows a notable increase, underscoring the importance of digital presence in revenue generation.
酷!因此,我们的 assistant 能够识别在线销售利润的显着增长,并推断出这表明了强大的数字业务的重要性。现在让我们为幻灯片获取一个引人注目的标题。
submit_message(assistant.id,thread,"Given the plot and bullet points you created,\
 come up with a very brief title for a slide. It should reflect just the main insights you came up with."
)
Run(id='run_q6E85J31jCw3QkHpjJKl969P', assistant_id='asst_3T362kLlTyAq0FUnkvjjQczO', cancelled_at=None, completed_at=None, created_at=1701827084, expires_at=1701827684, failed_at=None, file_ids=['file-piTokyHGllwGITzIpoG8dok3'], instructions='You are a data scientist assistant. When given data and a query, write the proper code and create the proper visualization', last_error=None, metadata={}, model='gpt-4-1106-preview', object='thread.run', required_action=None, started_at=None, status='queued', thread_id='thread_73TgtFoJMlEJvb13ngjTnAo3', tools=[ToolAssistantToolsCode(type='code_interpreter')])标题是
#Wait as assistant may take a few steps
time.sleep(10)
response = get_response(thread)
title = response.data[0].content[0].text.value
print(title)
"Ascending Profits & Digital Dominance"
3. DALL·E-3 标题图像
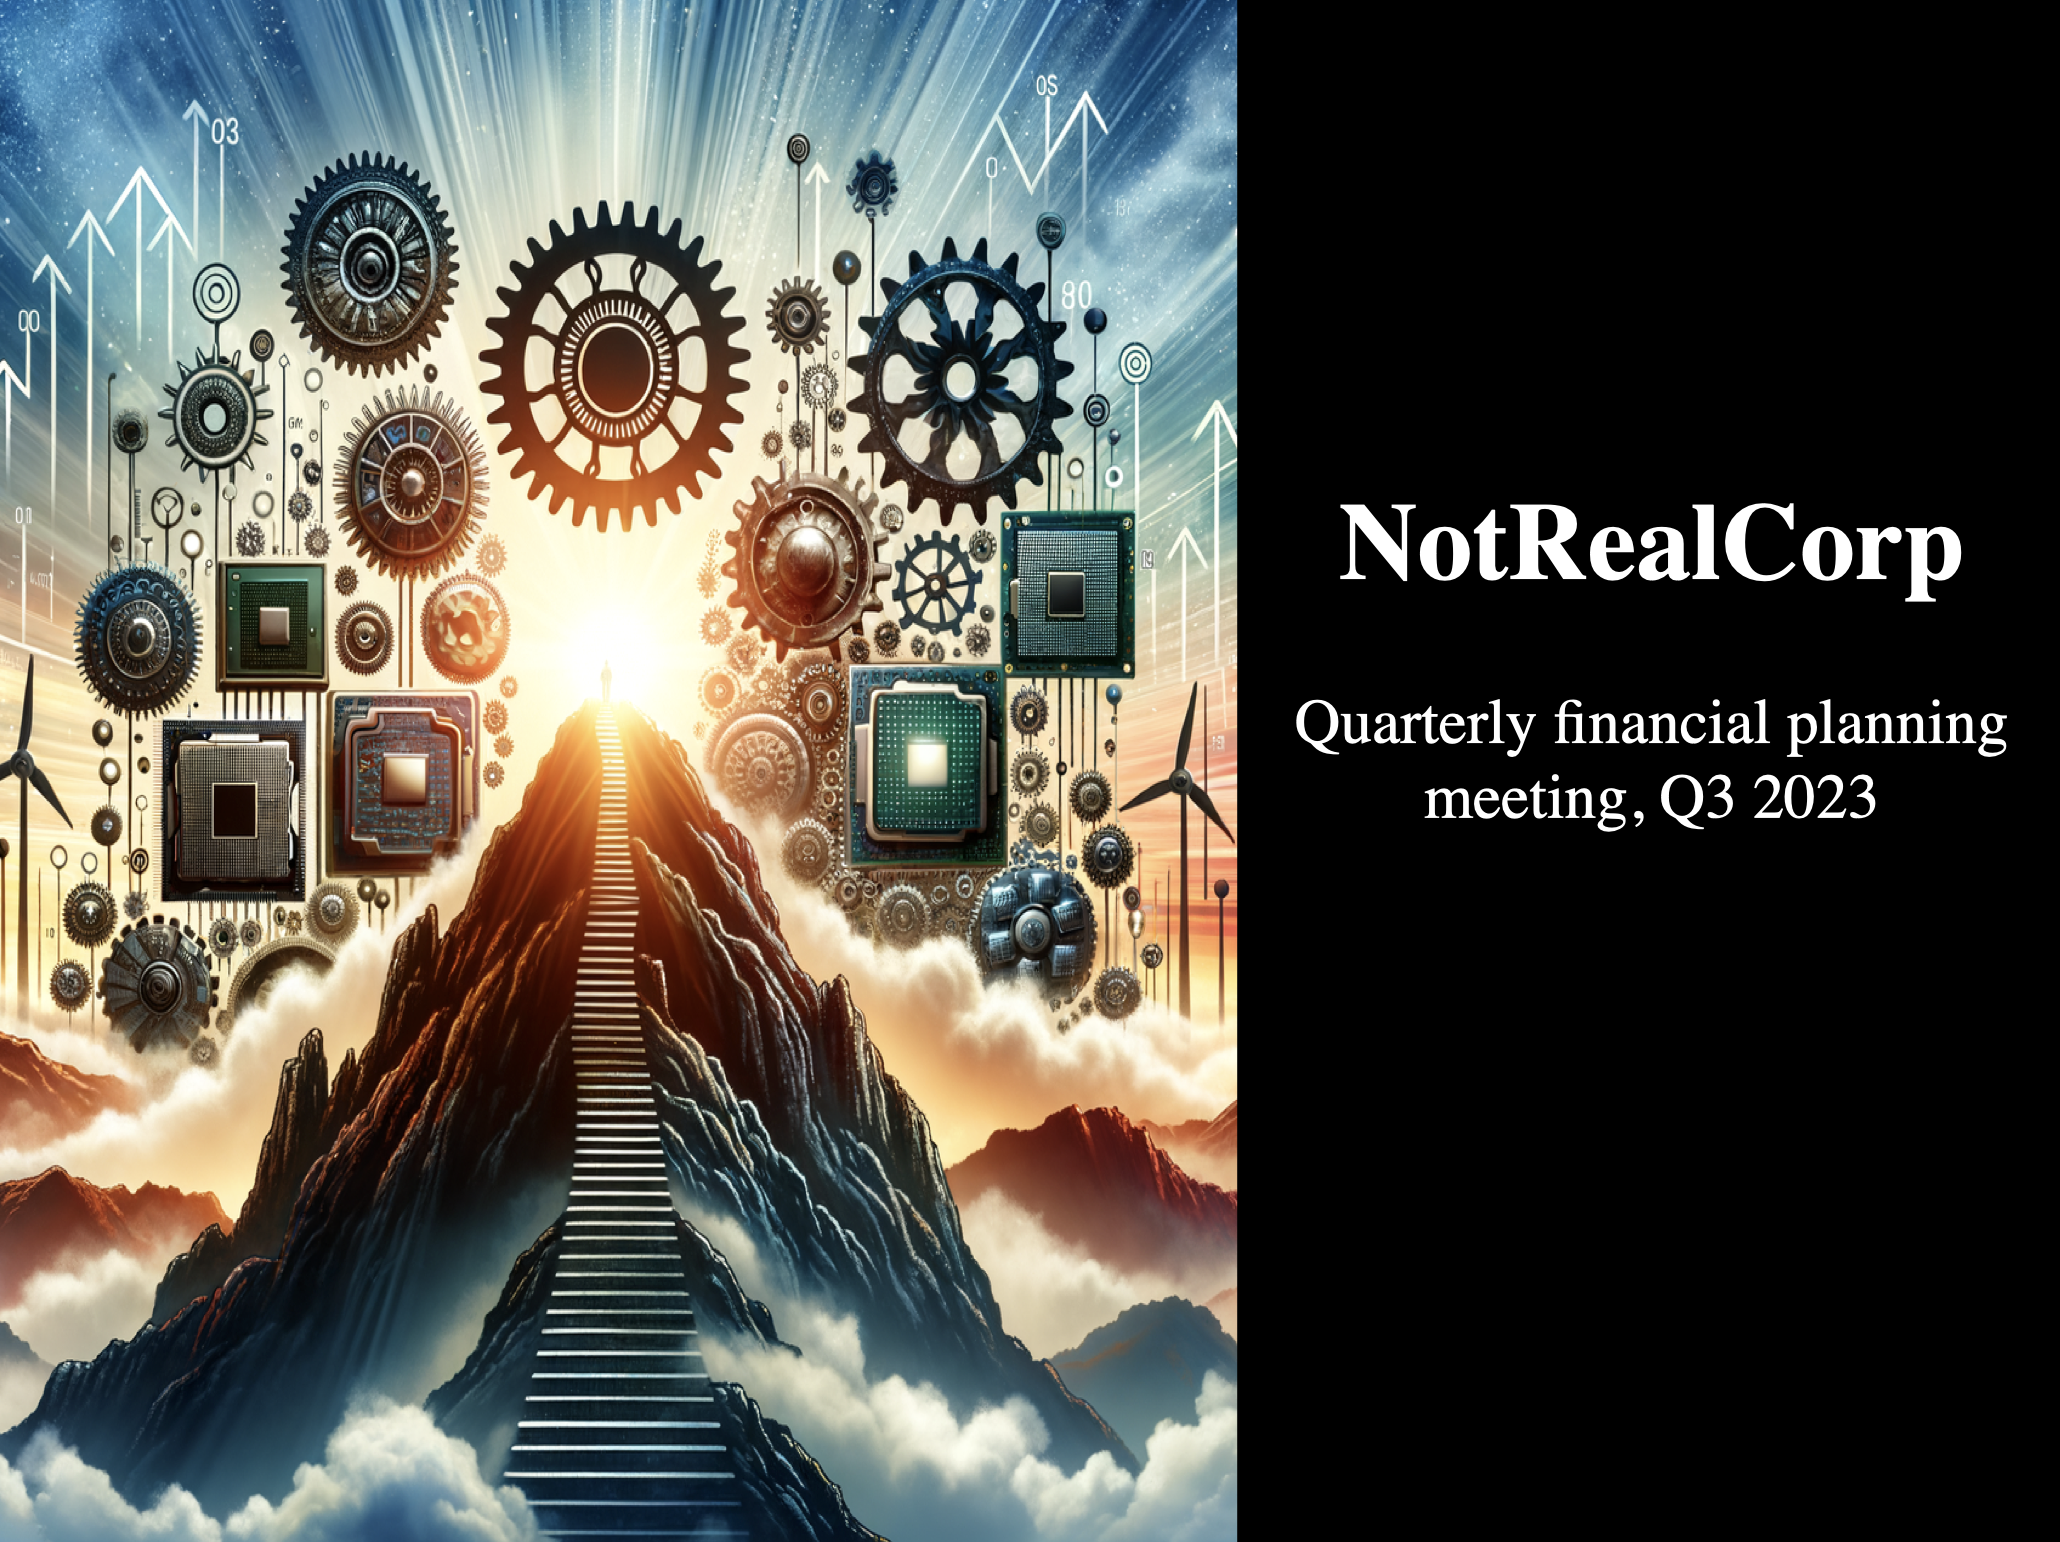
很好,现在我们有了一个标题、一个图表和两个要点。我们几乎准备好将所有这些放在幻灯片上,但作为最后一步,让我们让 DALL·E-3 生成一个图像,用作演示文稿的标题幻灯片。
注意: DALL·E-3 尚不可在 assistants API 中使用,但即将推出!
我们将输入我们公司 (NotRealCorp) 的简要描述,并让 DALL·E-3 完成剩下的工作!
company_summary = "NotReal Corp is a prominent hardware company that manufactures and sells processors, graphics cards and other essential computer hardware."
response = client.images.generate(
  model='dall-e-3',
  prompt=f"given this company summary {company_summary}, create an inspirational \
    photo showing the growth and path forward. This will be used at a quarterly\
       financial planning meeting",
       size="1024x1024",
       quality="hd",
       n=1
)
image_url = response.data[0].url
酷,现在我们可以将此图像添加到我们的线程中。首先,我们可以将图像本地保存,然后使用 `File` 上传端点将其上传到 assistants API。让我们也看看我们的图像
dalle_img_path = '../images/dalle_image.png'
img = requests.get(image_url)

#Save locally
with open(dalle_img_path,'wb') as file:
  file.write(img.content)

#Upload
dalle_file = client.files.create(
  file=open(dalle_img_path, "rb"),
  purpose='assistants'
)

4. 创建幻灯片
现在我们拥有创建幻灯片所需的所有内容。虽然我们可以简单地添加一条消息来请求幻灯片,但让我们改为给 assistant 一个幻灯片模板,使用 `python-pptx` 库来使用。这将确保我们获得我们想要的风格的演示文稿。有关创建模板的注释,请参阅笔记本末尾的 `Extensions` 部分。
title_template = """
from pptx import Presentation
from pptx.util import Inches, Pt
from pptx.enum.text import PP_PARAGRAPH_ALIGNMENT
from pptx.dml.color import RGBColor

# Create a new presentation object
prs = Presentation()

# Add a blank slide layout
blank_slide_layout = prs.slide_layouts[6]
slide = prs.slides.add_slide(blank_slide_layout)

# Set the background color of the slide to black
background = slide.background
fill = background.fill
fill.solid()
fill.fore_color.rgb = RGBColor(0, 0, 0)

# Add image to the left side of the slide with a margin at the top and bottom
left = Inches(0)
top = Inches(0)
height = prs.slide_height
width = prs.slide_width * 3/5
pic = slide.shapes.add_picture(image_path, left, top, width=width, height=height)

# Add title text box positioned higher
left = prs.slide_width * 3/5
top = Inches(2)
width = prs.slide_width * 2/5
height = Inches(1)
title_box = slide.shapes.add_textbox(left, top, width, height)
title_frame = title_box.text_frame
title_p = title_frame.add_paragraph()
title_p.text = title_text
title_p.font.bold = True
title_p.font.size = Pt(38)
title_p.font.color.rgb = RGBColor(255, 255, 255)
title_p.alignment = PP_PARAGRAPH_ALIGNMENT.CENTER

# Add subtitle text box
left = prs.slide_width * 3/5
top = Inches(3)
width = prs.slide_width * 2/5
height = Inches(1)
subtitle_box = slide.shapes.add_textbox(left, top, width, height)
subtitle_frame = subtitle_box.text_frame
subtitle_p = subtitle_frame.add_paragraph()
subtitle_p.text = subtitle_text
subtitle_p.font.size = Pt(22)
subtitle_p.font.color.rgb = RGBColor(255, 255, 255)
subtitle_p.alignment = PP_PARAGRAPH_ALIGNMENT.CENTER
"""

data_vis_template = """
from pptx import Presentation
from pptx.util import Inches, Pt
from pptx.enum.text import PP_PARAGRAPH_ALIGNMENT
from pptx.dml.color import RGBColor

# Create a new presentation object
prs = Presentation()

# Add a blank slide layout
blank_slide_layout = prs.slide_layouts[6]
slide = prs.slides.add_slide(blank_slide_layout)

# Set the background color of the slide to black
background = slide.background
fill = background.fill
fill.solid()
fill.fore_color.rgb = RGBColor(0, 0, 0)

# Define placeholders
image_path = data_vis_img
title_text = "Maximizing Profits: The Dominance of Online Sales & Direct Sales Optimization"
bullet_points = "• Online Sales consistently lead in profitability across quarters, indicating a strong digital market presence.\n• Direct Sales show fluctuations, suggesting variable performance and the need for targeted improvements in that channel."

# Add image placeholder on the left side of the slide
left = Inches(0.2)
top = Inches(1.8)
height = prs.slide_height - Inches(3)
width = prs.slide_width * 3/5
pic = slide.shapes.add_picture(image_path, left, top, width=width, height=height)

# Add title text spanning the whole width
left = Inches(0)
top = Inches(0)
width = prs.slide_width
height = Inches(1)
title_box = slide.shapes.add_textbox(left, top, width, height)
title_frame = title_box.text_frame
title_frame.margin_top = Inches(0.1)
title_p = title_frame.add_paragraph()
title_p.text = title_text
title_p.font.bold = True
title_p.font.size = Pt(28)
title_p.font.color.rgb = RGBColor(255, 255, 255)
title_p.alignment = PP_PARAGRAPH_ALIGNMENT.CENTER

# Add hardcoded "Key Insights" text and bullet points
left = prs.slide_width * 2/3
top = Inches(1.5)
width = prs.slide_width * 1/3
height = Inches(4.5)
insights_box = slide.shapes.add_textbox(left, top, width, height)
insights_frame = insights_box.text_frame
insights_p = insights_frame.add_paragraph()
insights_p.text = "Key Insights:"
insights_p.font.bold = True
insights_p.font.size = Pt(24)
insights_p.font.color.rgb = RGBColor(0, 128, 100)
insights_p.alignment = PP_PARAGRAPH_ALIGNMENT.LEFT
insights_frame.add_paragraph()


bullet_p = insights_frame.add_paragraph()
bullet_p.text = bullet_points
bullet_p.font.size = Pt(12)
bullet_p.font.color.rgb = RGBColor(255, 255, 255)
bullet_p.line_spacing = 1.5
"""
让我们为幻灯片设置一些快速变量。我们希望公司名称 NotRealCorp 出现在标题幻灯片上,演示文稿的标题应为“2023 年第三季度季度财务计划会议”。
title_text = "NotRealCorp"
subtitle_text = "Quarterly financial planning meeting, Q3 2023"
对于数据幻灯片,我们有
这里我们有一个创建标题幻灯片的模板。下面的模板是通过将所需标题幻灯片的图像上传到 GPT-V,并请求 `python-pptx` 代码来创建该模板而创建的。模板的输入是 image_path、title_text 和 subtitle_text。
submit_message(assistant.id,thread,f"Use the included code template to create a PPTX slide that follows the template format, but uses the image, company name/title, and document name/subtitle included:\
{title_template}. IMPORTANT: Use the image file included in this message as the image_path image in this first slide, and use the Company Name {title_text} as the title_text variable, and \
  use the subtitle_text {subtitle_text} a the subtitle_text variable. \
    NEST, create a SECOND slide using the following code template: {data_vis_template} to create a PPTX slide that follows the template format, but uses the company name/title, and document name/subtitle included:\
{data_vis_template}. IMPORTANT: Use the line plot image, that is the second attached image in this message, that you created earlier in the thread as the data_vis_img image, and use the data visualization title that you created earlier for the variable title_text, and\
  the bullet points of insights you created earlier for the bullet_points variable. Output these TWO SLIDES as a .pptx file. Make sure the output is two slides, with each slide matching the respective template given in this message.",
              file_ids=[dalle_file.id, plot_file.id]
)
Run(id='run_taLrnOnlDhoywgQFFBOLPlg0', assistant_id='asst_3T362kLlTyAq0FUnkvjjQczO', cancelled_at=None, completed_at=None, created_at=1701827118, expires_at=1701827718, failed_at=None, file_ids=['file-piTokyHGllwGITzIpoG8dok3'], instructions='You are a data scientist assistant. When given data and a query, write the proper code and create the proper visualization', last_error=None, metadata={}, model='gpt-4-1106-preview', object='thread.run', required_action=None, started_at=None, status='queued', thread_id='thread_73TgtFoJMlEJvb13ngjTnAo3', tools=[ToolAssistantToolsCode(type='code_interpreter')])#May take 1-3 mins
while True:
try:
response = get_response(thread)
pptx_id = response.data[0].content[0].text.annotations[0].file_path.file_id
print("Successfully retrieved pptx_id:", pptx_id)
break
except Exception as e:
print("Assistant still working on PPTX...")
time.sleep(10)
Assistant still working on PPTX...
Assistant still working on PPTX...
Assistant still working on PPTX...
Assistant still working on PPTX...
Assistant still working on PPTX...
Assistant still working on PPTX...
Assistant still working on PPTX...
Assistant still working on PPTX...
Assistant still working on PPTX...
Assistant still working on PPTX...
Successfully retrieved pptx_id: file-oa0i63qPH4IaJXYj90aA6L4Q
pptx_id = response.data[0].content[0].text.annotations[0].file_path.file_id
ppt_file= client.files.content(pptx_id)
file_obj = io.BytesIO(ppt_file.read())
with open("data/created_slides.pptx", "wb") as f:
    f.write(file_obj.getbuffer())
现在,我们有一个 PPTX 文件,其中保存了我们创建的所有内容!
让我们看一下我们仅使用 assistants API 和 DALL·E-3 创建的 .pptx 的屏幕截图。由于 Assistants API 中尚无 `seed` 参数,因此 DALL·E-3 图像和措辞将与您运行此笔记本时看到的内容略有不同,这是由于 LLM 的非确定性,但输出在方向上应相同。
标题幻灯片
数据幻灯片
5. 结论
哇!虽然这些幻灯片可能需要一些格式调整,但我们已经使用 Assistants API、GPT-4 和 DALL·E-3 制作了一些很棒的内容。我们能够使用包含财务数据的 `.csv` 文件,并使用我们的 assistant 来计算跨分销渠道的季度利润,绘制结果,从可视化中识别见解和主要要点,并创建一个总结性标题。而且,仅给定我们公司 NotRealCorp 的描述,我们就使用 DALL·E-3 制作了一个很棒的标题图像。
虽然我们距离完全自动化此过程而无需人工干预还有一段距离,但希望本笔记本可以使幻灯片创建过程对您来说更容易一些。更重要的是,本笔记本可以理想地让您了解 assistants API 的潜力!我们很高兴看到您构建的内容。
6. 扩展
- 当 DALL·E-3 合并到 Assistants API 中时,我们将能够在线程中请求生成的标题图像。
- GPT-4-Vision 尚不支持 Assistants API,但可以用于从折线图图像中收集见解。
- GPT-4-Vision 用于生成本食谱中包含的 `python-pptx` 模板,因此一个潜在的扩展项目可能是演示围绕将图像转换为幻灯片模板的最佳实践。